PMC COVID-19 Data Dashboard
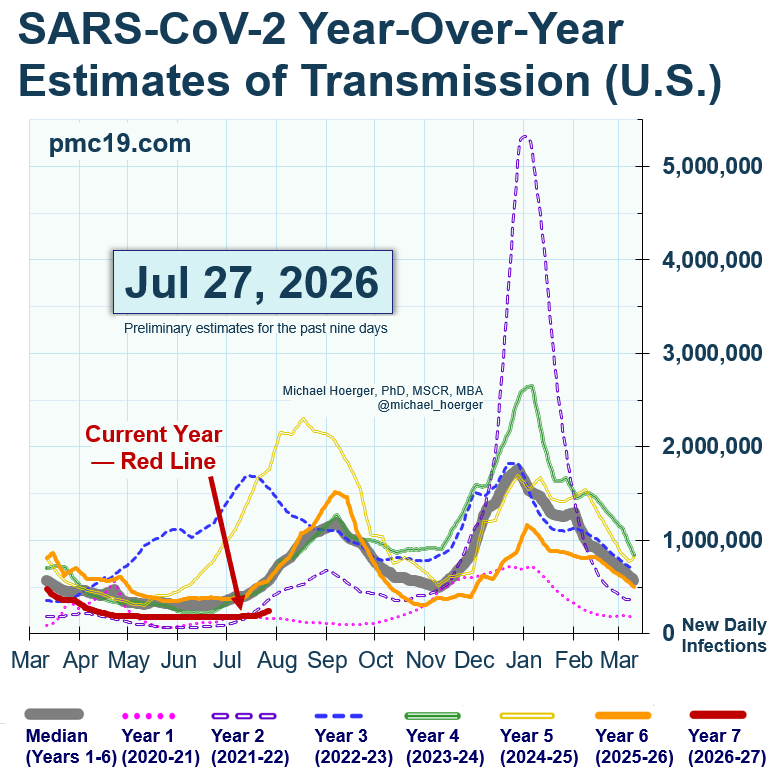
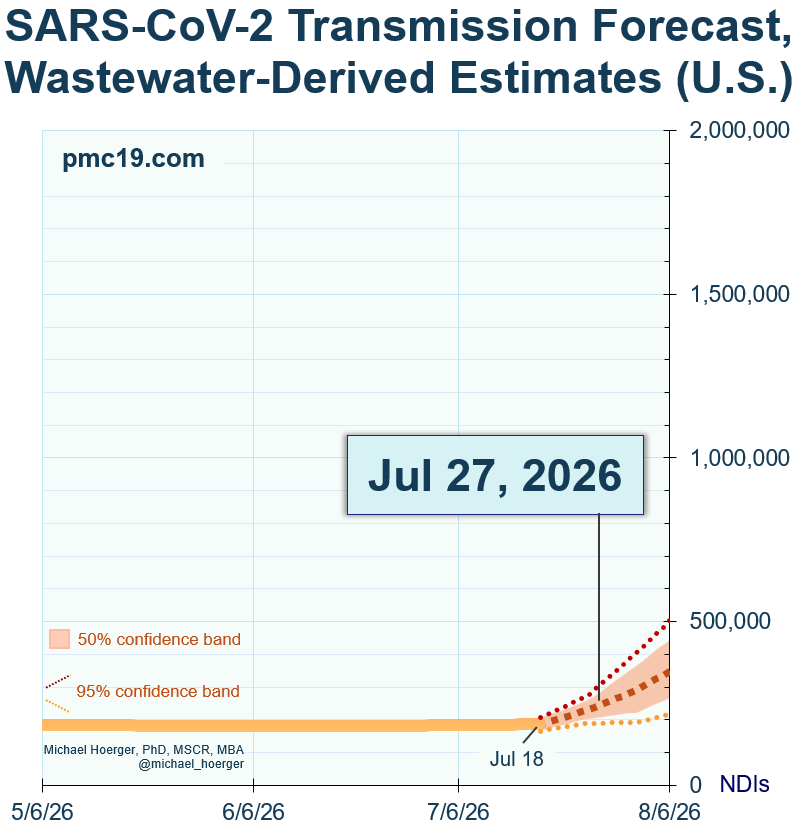
July 27, 2026 - Report
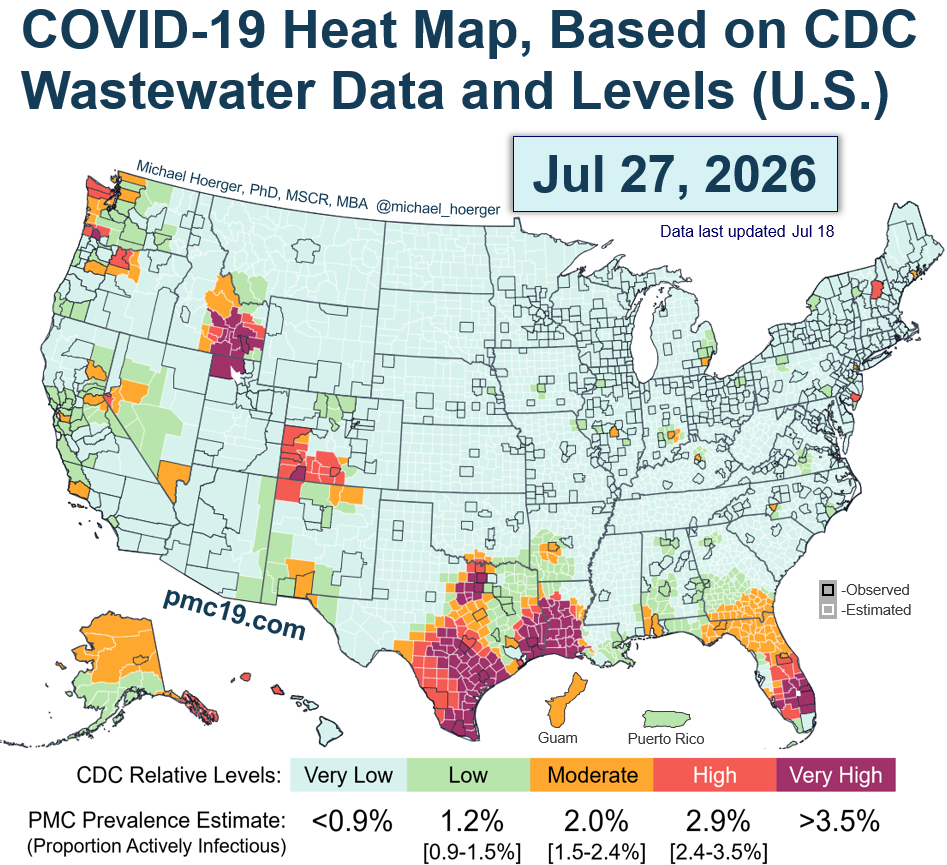
The US has 10 hot spots. There are major outbreaks across much of Texas (high/very high). Houston, denoted by the light blue county in the southeast (Harris) has 1-3-week reporting lags at most sites so may be worse than noted. Hardin county, two counties over to the east/northeast, continues to experience BA.1 Omicron-level transmission. The Texas surge is bleeding into estimates for western Louisiana.
There are 9 other outbreaks: southeast Alaska (Juneau, high), Hawai’i (Honolulu and Kauai, high), north central Oregon through the Washington coast (high), western Nevada (Carson City, high), the Utah-Idaho border region (very high), southwestern Colorado (high/very high), southern Florida (high/very high), Atlantic City, New Jersey (high), and Grafton County, New Hampshire (high). The outbreaks in the Bay Area and Guam declined since last week. Note that the CDC state-level map shows no state median in the high/very high range, which is atypical. Higher levels tend to be more widespread this time of year.
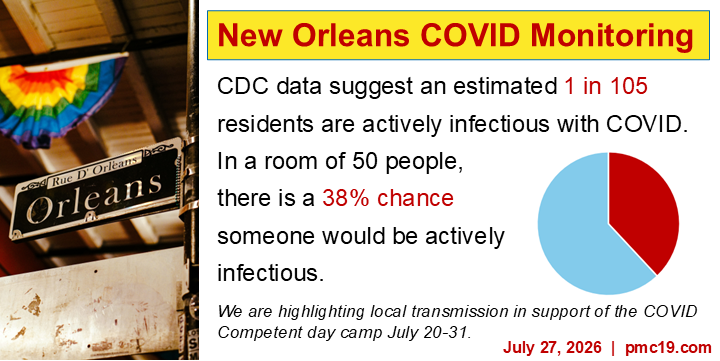
We are highlighting local transmission here in New Orleans, given the outbreak in eastern Texas and the COVID Competent day camp in progress from July 20-31.
Use the desktop interactive map to scroll over each county for more detail. See the CDC's map for state-level estimates only.
Most recent Technical Appendix (last updated June 29, 2026).
Background on Dr. Hoerger and the PMC
Historical Reports
Prior Reports - Model Version 3
7/20/26 | 7/13/26 | 6/29/26 | 6/22/26 | 6/15/26 | 6/8/26 | 6/1/26 | 5/18/26 | 5/11/26 | 5/4/26 | 4/20/26 | 4/13/26 | 4/6/26 | 3/30/26 | 3/23/26 | 3/9/26 | 3/2/26 | 2/23/26 | 2/16/26 | 2/9/26 | 2/2/26 | 1/26/26 | 1/19/26 | 1/12/26 | 1/5/26 | 12/29/25 | 12/22/25 | 12/15/25 | 12/8/25 | 12/1/25 | 11/24/25 | 11/10/25 | 11/3/25 | 10/27/25 | 10/20/25 | 10/6/25 | 9/29/25 | 9/22/25 | 9/15/25 | 9/8/25 | 9/1/25
Prior Technical Appendices - Model Version 3
06/01/26 | 3/23/26 | 9/1/25
Prior Reports - Model Version 2
8/11/25 | 8/4/25 | 7/28/25 | 7/21/25 | 7/14/25 | 6/30/25 | 6/23/25 | 6/16/25 | 6/9/25 | 6/2/25 | 5/26/25 | 5/19/25 | 5/12/25 | 5/5/25 | 4/21/25 | 4/14/25 | 4/7/25 | 3/31/25 | 3/24/25 | 3/17/25 | 3/10/25 | 3/3/25 | 2/24/25 | 2/17/25 | 2/10/25 | 2/3/25 | 1/27/25 | 1/20/25 | 1/6/25 | 12/30/24 | 12/23/24 | 12/16/24 | 12/9/24 | 11/25/24 | 11/18/24 | 11/11/24 | 11/4/24 | 10/28/24 | 10/21/24 | 10/14/24 | 10/7/24 | 9/30/24 | 9/23/24 | 9/16/24 | 9/9/24 | 9/2/24 | 8/26/24 | 8/19/24 | 8/12/24
Prior Technical Appendices - Model Version 2
5/19/25 | 3/31/25 | 3/24/25 | 1/20/25 | 11/25/24 | 11/4/24 | 9/30/24 | 9/9/24 | 8/19/24
Prior Reports and Technical Information (Combined) - PMC Model Version 1
8/2/24 | 7/26/24 | 7/19/24 | 7/12/24 | 7/5/24 | 6/28/24 | 6/21/24 | 6/14/24 | 6/7/24 | 5/31/24 | 5/24/24 | 5/13/24 | 5/6/24 | 4/29/24 | 4/22/24 | 4/15/24 | 4/8/24 | 4/1/24 | 3/25/24 | 3/18/24 | 3/11/24 | 3/4/24 | 2/26/24 | 2/19/24 | 2/12/24 | 2/5/24 | 1/29/24 | 1/22/24 | 1/15/24 | 1/8/24 | 12/25/23 | 12/18/23 | 12/11/23 | 12/4/23 | 11/27/23 | 11/20/23 | 11/13/23 | 11/6/23 | 10/30/23 | 10/23/23 | 10/2/23 | 9/20/23 | 9/13/23 | 9/6/23 | 8/30/23 | 8/23/23 | 8/16/23 | 8/9/23 | 8/2/23
U.S. State and Regional Data
- Multiple Regions:
- CDC: CDC National/Regional Data
- Biobot: Biobot Reports
- WastewaterSCAN: WastewaterSCAN National/Regional Data
- World Health Network: National and Selected State Case Estimates
- Iowa COVID-19 Tracker (National): Integrated CDC and WastewaterSCAN Visualizations (requires WordPress registration)
- Alabama: CDC Alabama | WastewaterSCAN Alabama
- Alaska: CDC Alaska | WastewaterSCAN Alaska
- Arizona: CDC Arizona | WastewaterSCAN Arizona - N/A
- Arkansas: CDC Arkansas | WastewaterSCAN Arkansas
- California: CDC California | WastewaterSCAN California | California Department of Public Health
- Central Valley Area: WastewaterSCAN Central Valley
- Los Angeles Area: WastewaterSCAN Greater LA
- San Francisco Bay Area: WastewaterSCAN Greater SF Bay Area | WastewaterSCAN Marin County | South Bay Santa Clara County
- Colorado: CDC Colorado | WastewaterSCAN Colorado
- Connecticut: CDC Connecticut | WastewaterSCAN Connecticut | Yale New Haven
- Delaware: CDC Delaware | WastewaterSCAN Delaware
- District of Columbia: CDC DC | WastewaterSCAN DC (No Updates)
- Florida: CDC Florida | WastewaterSCAN Florida
- Georgia: CDC Georgia | WastewaterSCAN Georgia
- Atlanta Area: WastewaterSCAN Greater Atlanta
- Guam: CDC Guam | WastewaterSCAN Guam (N/A)
- Hawaii: CDC Hawaii | WastewaterSCAN Hawaii
- Idaho: CDC Idaho | WastewaterSCAN Idaho
- Illinois: CDC Illinois | WastewaterSCAN Illinois | University of Illinois
- Indiana: CDC Indiana | WastewaterSCAN Indiana | Indiana Department of Health
- Iowa: CDC Iowa | WastewaterSCAN Iowa | University of Iowa
- Kansas: CDC Kansas | WastewaterSCAN Kansas
- Kentucky: CDC Kentucky | WastewaterSCAN Kentucky
- Louisiana: CDC Louisiana | WastewaterSCAN Louisiana
- Maine: CDC Maine | WastewaterSCAN Maine
- Maryland: CDC Maryland | WastewaterSCAN Maryland
- Massachusetts: CDC Massachusetts | WastewaterSCAN Massachusetts
- Michigan: CDC Michigan | WastewaterSCAN Michigan | State of Michigan
- Minnesota: CDC Minnesota | WastewaterSCAN Minnesota | Department of Health
- Mississippi: CDC Mississippi | WastewaterSCAN Mississippi
- Missouri: CDC Missouri | WastewaterSCAN Missouri (N/A) | Univesity of Missouri
- Montana: CDC Montana | WastewaterSCAN Montana (N/A)
- Nebraska: CDC Nebraska | WastewaterSCAN Nebraska | City of Lincoln
- Nevada: CDC Nevada | WastewaterSCAN Nevada
- New Hampshire: CDC New Hampshire | WastewaterSCAN New Hampshire
- New Jersey: CDC New Jersey | WastewaterSCAN New Jersey
- New Mexico: CDC New Mexico | WastewaterSCAN New Mexico (N/A)
- New York: CDC New York | WastewaterSCAN New York | New York State
- North Carolina: CDC North Carolina | WastewaterSCAN North Carolina
- North Dakota: CDC North Dakota (No Data) | WastewaterSCAN North Dakota (N/A)
- Ohio: CDC Ohio | WastewaterSCAN Ohio | Ohio Department of Health
- Oklahoma: CDC Oklahoma | WastewaterSCAN Oklahoma (N/A)
- Oregon: CDC Oregon | WastewaterSCAN Oregon (N/A)
- Puerto Rico: Government of Puerto Rico
- Pennsylvania: CDC Pennsylvania | WastewaterSCAN Pennsylvania | State of Pennsylvania (click from RSV to SARS-CoV-2) | City of Philadelphia
- Rhode Island: CDC Rhode Island | WastewaterSCAN Rhode Island (N/A) | Rhode Island Department of Health
- South Carolina: CDC South Carolina | WastewaterSCAN South Carolina (No Updates)
- South Dakota: CDC South Dakota | WastewaterSCAN South Dakota
- Tennessee: CDC Tennessee | WastewaterSCAN Tennessee
- Texas: CDC Texas | WastewaterSCAN Texas
- Utah: CDC Utah | WastewaterSCAN Utah
- Vermont: CDC Vermont | WastewaterSCAN Vermont
- Virginia: CDC Virginia | WastewaterSCAN Virginia
- Washington (state): CDC Washington | WastewaterSCAN Washington | Washington State Department of Health
- West Virginia: CDC West Virginia | WastewaterSCAN West Virginia
- Wisconsin: CDC Wisconsin | WastewaterSCAN Wisconsin | Wisconsin Department of Health Services
- Wyoming: CDC Wyoming | WastewaterSCAN Wyoming (N/A)
International Surveillance Data

- Australia:
- Austria:
- Belgium: Belgian Institute for Health
- Canada:
- Czech Republic: State Health Institute Czech Republic
- Denmark: Statens Serum Institut Denmark
- Europe (multi-national): EU Wastewater Observatory
- Finland:
- France:
*See the numbers 1-21 along the lower left. Click on 3-6 for national and regional data.
** Click on the dropdown menu. May need to try a different web browser.
